Occupancy Count#
Introduction#
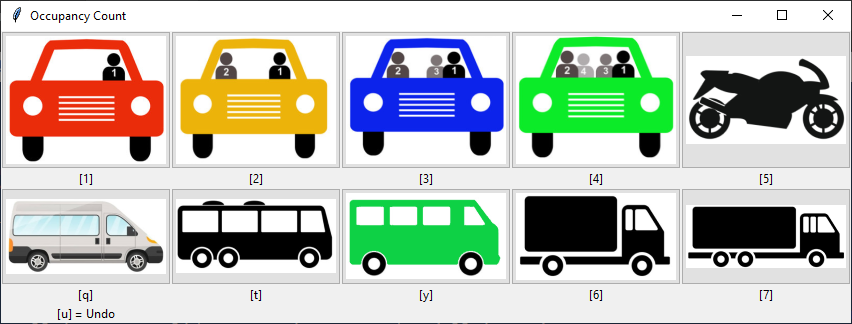
While at WSDOT, I developed a Python tool with a Tkinter GUI for the collection of data. This tool allows a user to manually collect transportation occupancy information using a touch-enabled device, mouse, or keyboard shortcuts. Log files record all actions taken by users, and a summary script exports a CSV file of the results.
The tool I developed replaced an Excel workbook that offered similar functions but also had several shortcomings.
No automatic saving. This script required either reconfiguration of the Microsoft Excel parameters for autosave, or vigilance from users. In several instances data was lost because users did not save or the program terminated unexpectedly.
No Shortcuts. Microsoft Excel allows minimal remapping of keyboard shortcuts which limits the customization, and reduces the efficiency for users.
Difficult Modification. The original tool was not designed to be easily modifiable. This tool allows simple customization of how data is stored, keyboard shortcuts, and changing icons to meet future needs.
Run the Tool#
Running the tool requires Python 3+ and the Pandas library. If there are any other missing libraries they can be installed using the python package manager with the following command.
pip install [package]
Configuration#
The configuration.json file contains the configuration parameters for the script. The table below describes the JSON name used in the script. If you want to modify a parameter such as changing the single occupant passenger car one_passenger_car to a update the file as follows.
{
"keyboard_shortcuts": {
    "one_passenger_car": "a",
    "two_passenger_car": "2",
...
You can also make changes to the way data is stored. For example, you could change the single occupant passenger car storage value from the default of P1 to Passenger1.
...
"data_parameters": {
    "one_passenger_car": "Passenger1",
    "two_passenger_car": "P2",
    "three_passenger_car": "P3",
...
Keyboard Shortcuts#
JSON name |
Shortcut |
|---|---|
one_passenger_car |
Single occupant passenger car |
two_passenger_car |
Two occupant passenger car |
three_passenger_car |
Three occupant passenger car |
four_passenger_car |
Four occupant passenger car |
motorcycle |
Motorcycle |
two_axle_truck |
Two axle truck |
three_axle_truck |
Three axle truck |
van |
Passenger or work van |
transit |
Transit vehicle with government agency branding |
transit_other |
Non-governmental transit vehicle |
undo |
Undo last action |
Starting the Script#
To run the script enter the following in the command prompt
python occupancy_count.py
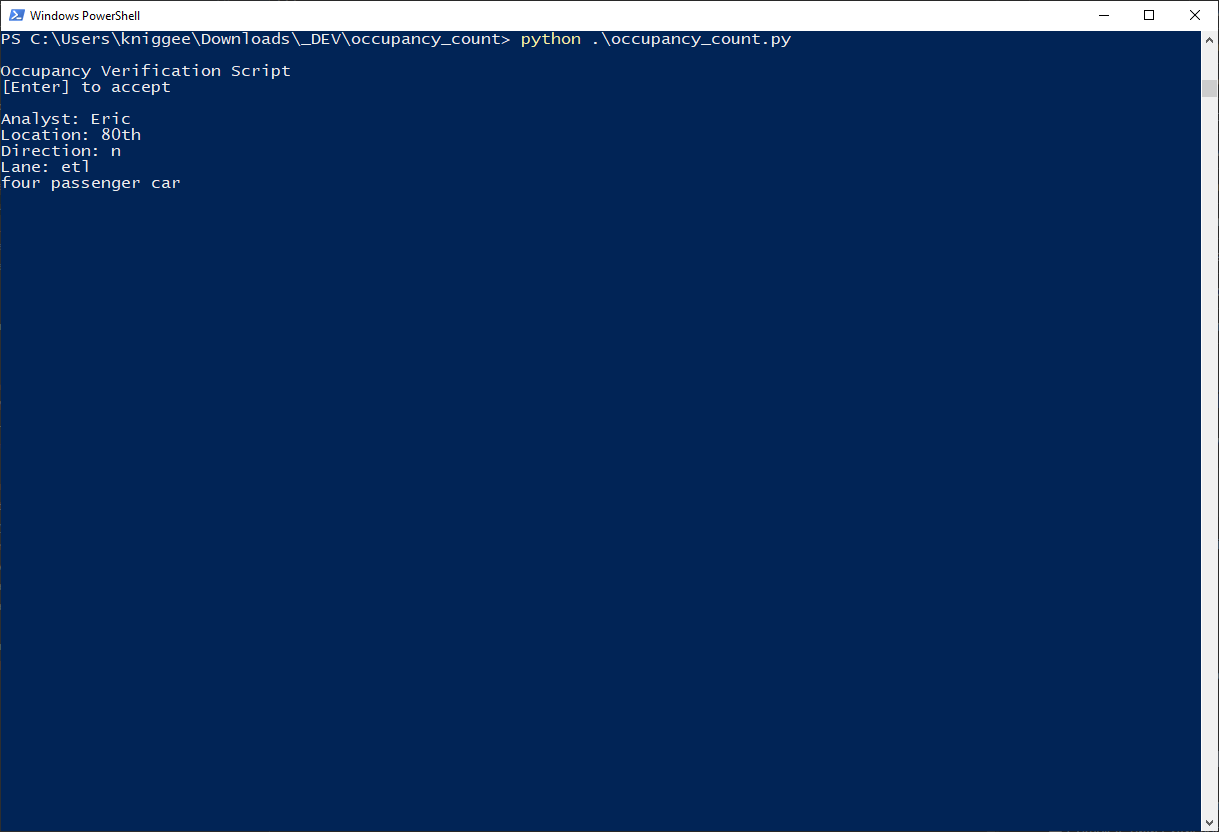
In the command prompt you will be required to enter a few fields to record who collected the data and where.

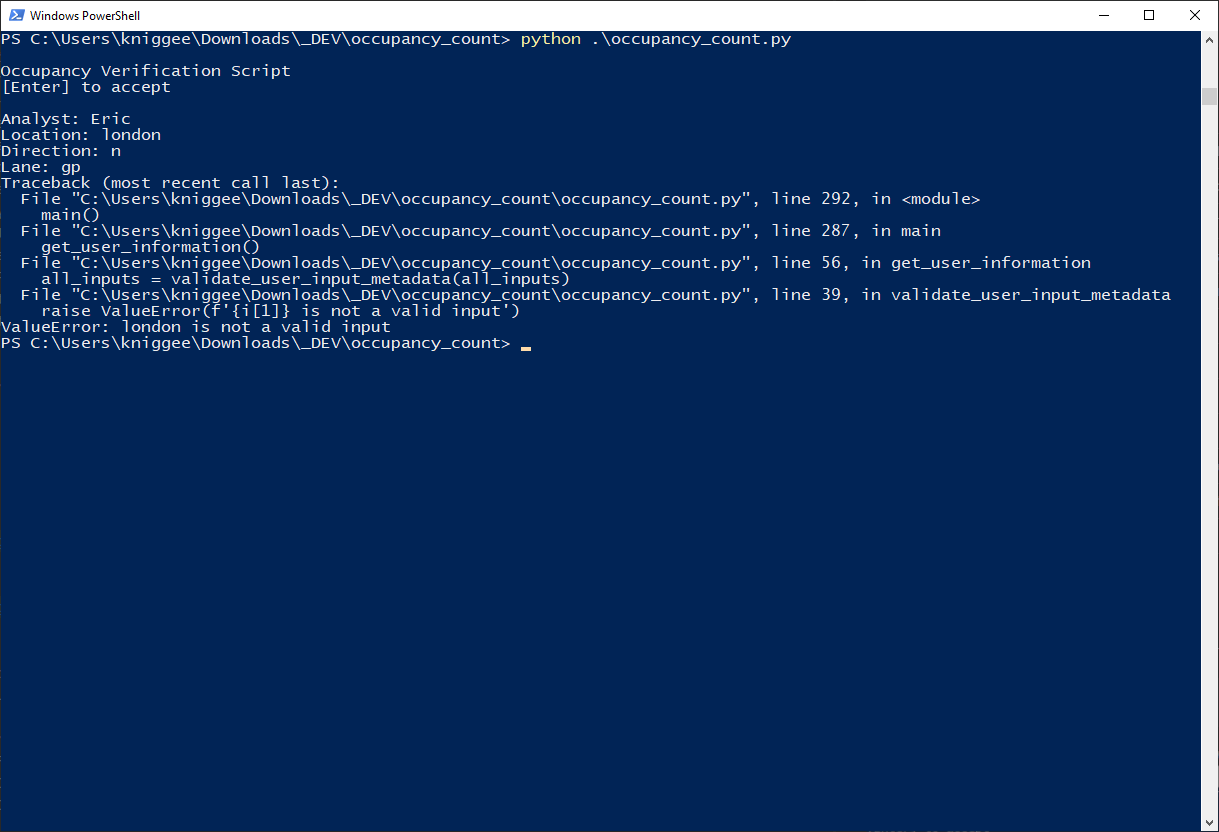
If you enter an invalid field you will get an error

If you want to make changes which fields are validated and how information is checked, make updates to the validate_user_input_metadata function.
Start the collection#
You may enter data using an input device such as touch, keyboard, or using the shortcuts listed below each data field.

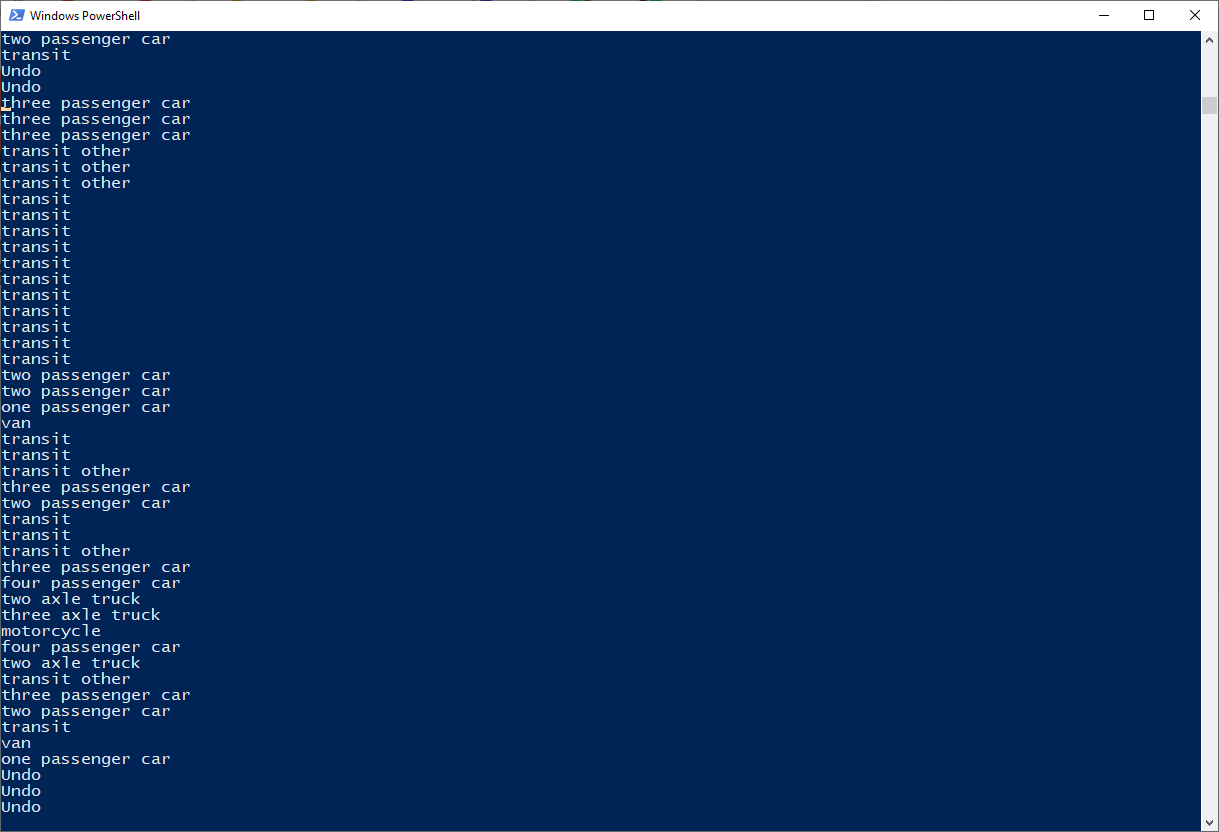
You can also monitor the system using the command window. It displays all actions taken by the operator.

When you are done with data collection simply close out the collection window.
Extract Data#
To extract data to a CSV all_data_extracted.csv file, run the other script that comes with this module. This file reads all logs in the collection directory, extracts the relevant information, and outputs the results to a csv file.
python extract_log_data.py
Summarize Data#
You can create a summary spreadsheet, summary_results.xlsx, if you utilize the summarize_log_data.py script. This summary closely matches what was done in previous years. The output creates a workbook with two worksheets, one for a data summary, and the other for an AM/PM summary for each type of vehicle.
python summarize_log_data.py